At work recently I find myself needing to make some rather boring reports composed almost solely of numbers and values week after week. Since some of these reports are now going to higher up people, who do not need most insignificant details I found myself needing a little refresher on making somewhat decent visuals. So before I dove into throwing those work reports some colour, I decided to practice a bit beforehand. And what better data set than The Simpsons US Viewers and IMDB ratings of course!
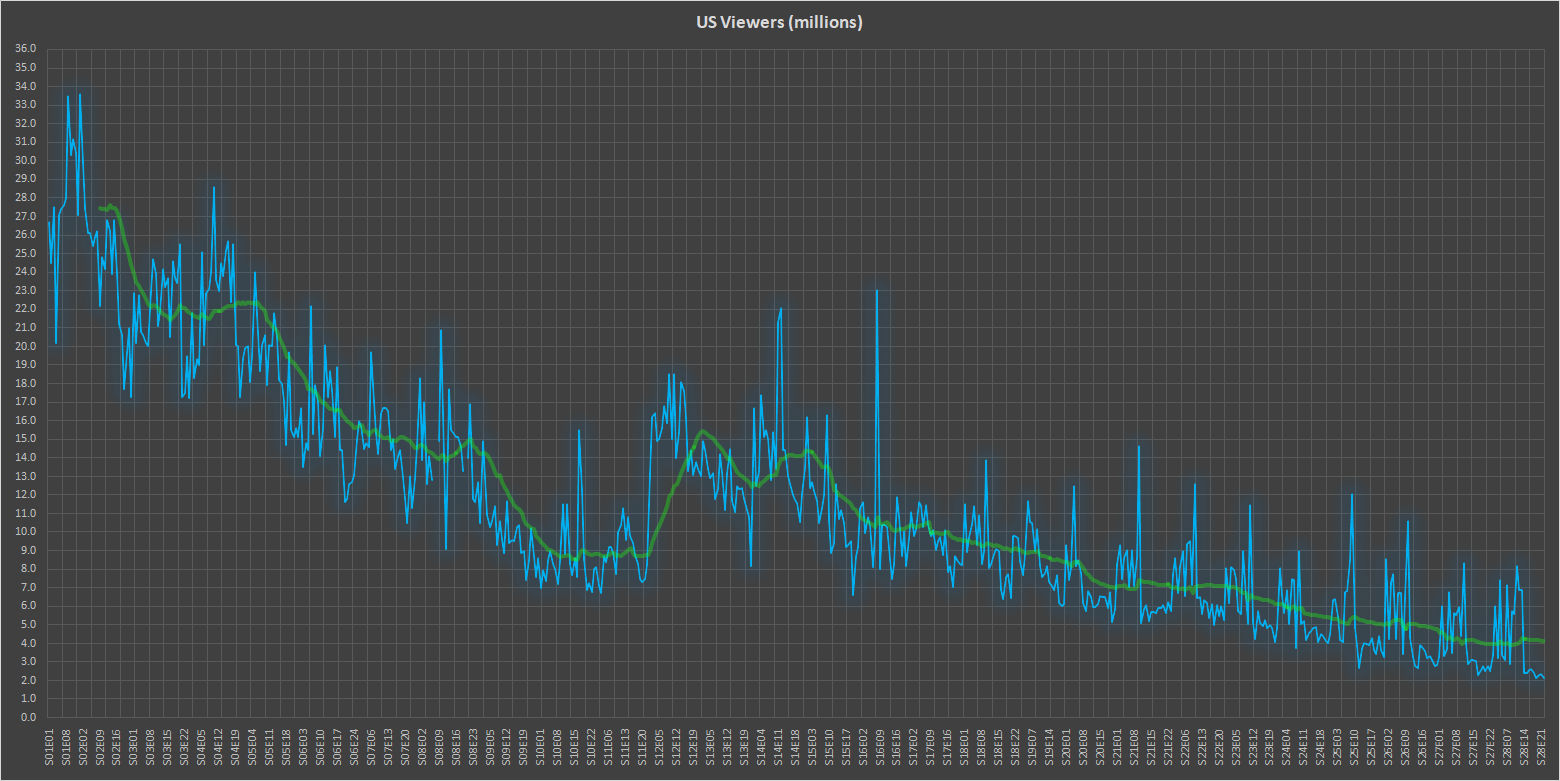
While it’s no secret that The Simpsons viewership has declined over the years, it was quite surprising to see how far they’ve fallen. Somewhere around season 12 there was a short lived resurgence but it never made made it back to where to show once was (I’d say this is normal though). And while there is no question about decline of quality, I would argue that it is not the only factor leading to the dwindling show watchers. Keep in mind The Simpsons came out in the late 80s so this was a time long before entire seasons were available on VHS or DVD, before pirating was commonplace, and before TV on demand was a thing. Back then to catch an episode you actually had to tune into when the episode aired or risk not seeing it for years. As technology marched forward, turning on the TV because less important and TV stations all over the world felt the effect. So the quality of the episodes are not only at fault but it certainly does not help that the Simpsons wit was slowly replaced with overused slapstick antics.
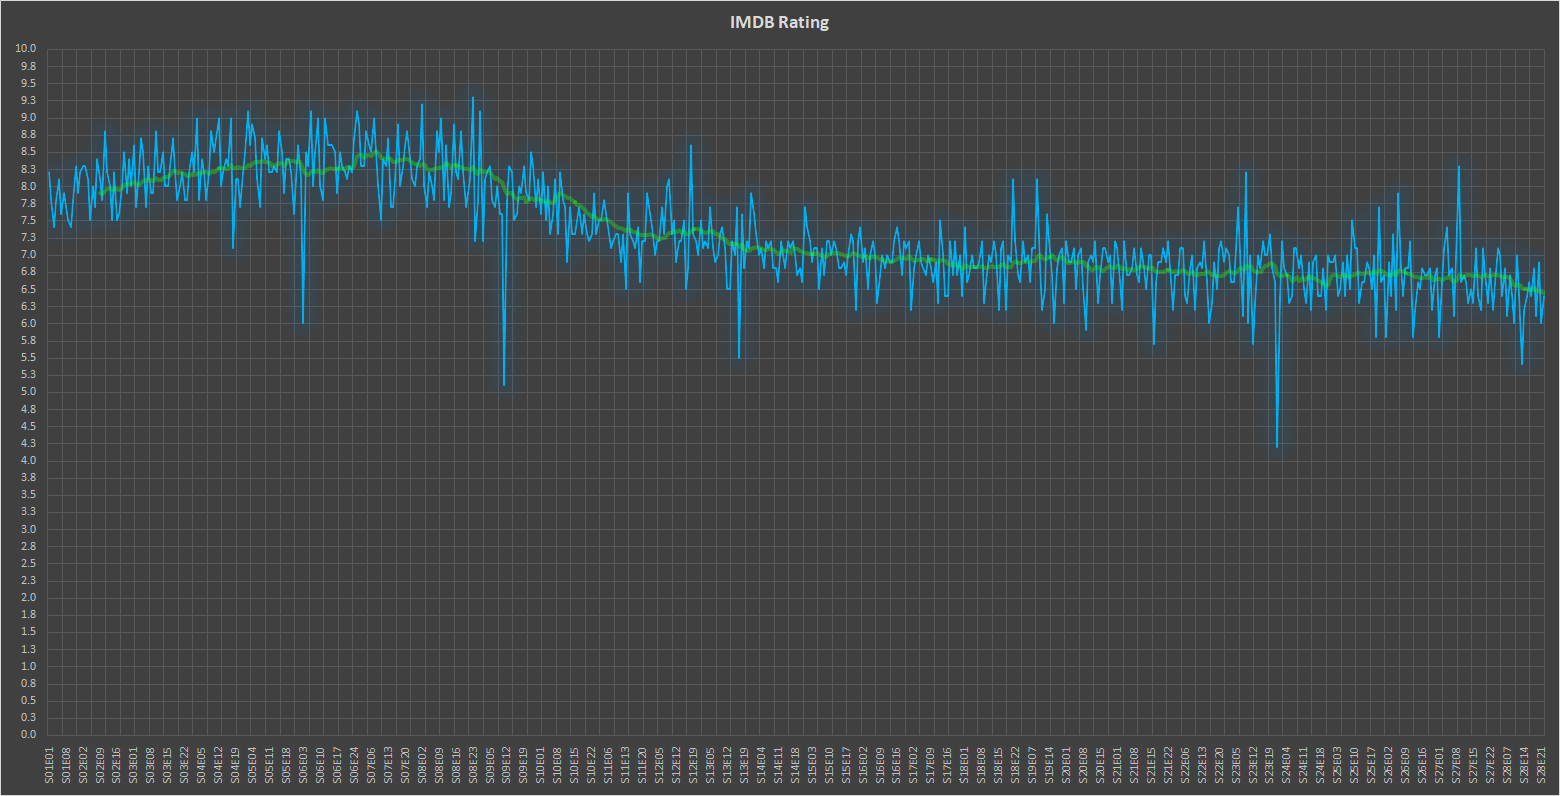
As you can see by each episodes IMDB rating (I know it’s probably not the most reliable source) sometime around season 9 the quality began to drop as well. Indeed the golden years of The Simpsons was coming to an end right as I was getting old enough to understand all the clever jokes. Fortunately Futurama came along after!
